Numerical Characteristics of Data (Mean, Variance, etc.)
CSCA Numerical Characteristics of Data (Mean, Variance, etc.) study guide organized around the publicly available CSCA syllabus. Practice Mathematics questions on aicsca.com.
Before planning this topic, check the CSCA Exam Guide 2026 for exam dates, registration, fees, and subject requirements.
Syllabus Alignment
This study guide is organized around the publicly available CSCA syllabus for international undergraduate applicants.
Who It Is For
International students preparing for CSCA Math, Physics, Chemistry, or Chinese exams.
Related Practice
CSCA Practice · Go to questions
Past papers and worked video solutions · Timed mock exams · All subject video lessons
Practice by Topic
Jump from this tutorial to filtered practice questions for the same knowledge point.
Related formulas, concepts, and glossary terms
Mathematics Formula & Concept Reference
- Sample Variance Formula
- Sample Mean
- Population Mean and Variance Formulas
- Sample Standard Deviation Formula
- Population Variance
- Sample Standard Deviation
- Population Standard Deviation
- Sample Mean Formula
Mathematics Exam Glossary
Tutorial Content
Numerical Characteristics of Data (Mean, Variance, etc.)
Core Conceptual Framework
Statistics describes a set of data (sample $x_1, x_2, ..., x_n$) primarily through two dimensions of numerical characteristics:
1. **Central Tendency**: Finding the "center" or "representative value" of the data. The most common is the **Mean**.
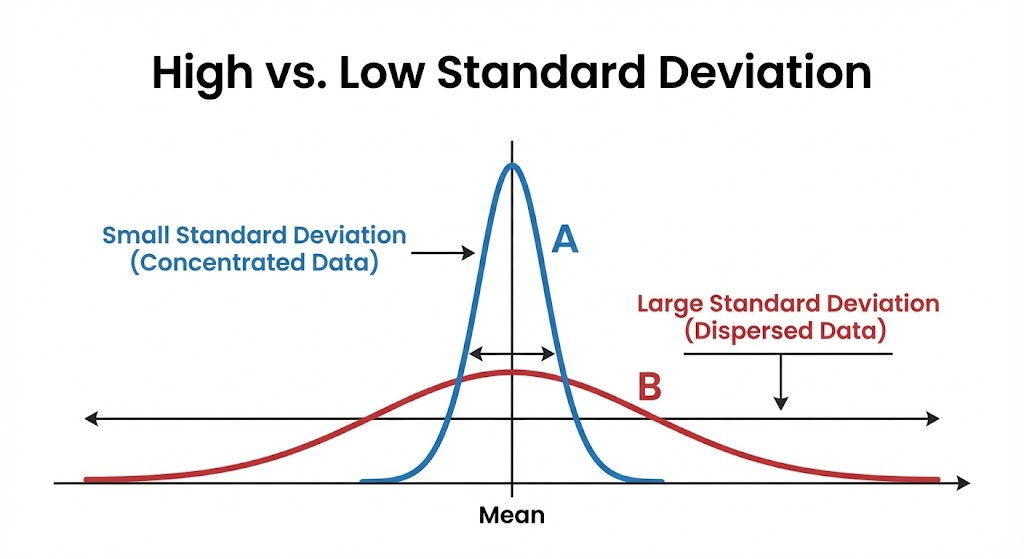
2. **Dispersion**: Measuring the "volatility" or "spread" of the data. The most common are **Variance** and **Standard Deviation**.
1. Mean
* **Definition**: The arithmetic average of all data, reflecting the "average level."
* **Symbol**: Usually denoted as $\bar{x}$ (sample mean) or $\mu$ (population mean).
* **Formula**:
$$\bar{x} = \frac{1}{n} \sum_{i=1}^{n} x_i$$
* **Physical Meaning**: The mean is the "center of gravity" of the data. If data points are viewed as physical weights, the mean is the balance point of the lever.
2. Variance and Standard Deviation
* **Definition**: Measures how far data points deviate from the mean. **The larger the variance, the more dispersed the data; the smaller the variance, the more stable the data.**
* **Formulas** (Note the difference in denominators):
* **Sample Variance ($s^2$)**: Used when estimating the population from a sample. The denominator is $n-1$ (unbiased estimator).
$$s^2 = \frac{1}{n-1} \sum_{i=1}^{n} (x_i - \bar{x})^2$$
* **Sample Standard Deviation ($s$)**: The arithmetic square root of the variance. It has the same units as the original data, making it more intuitive.
$$s = \sqrt{s^2}$$
* *Note: If the data is considered a complete population, the denominator for variance is usually $N$. Pay attention to whether the CSCA question emphasizes "Sample".*
3. Typical Calculation Example
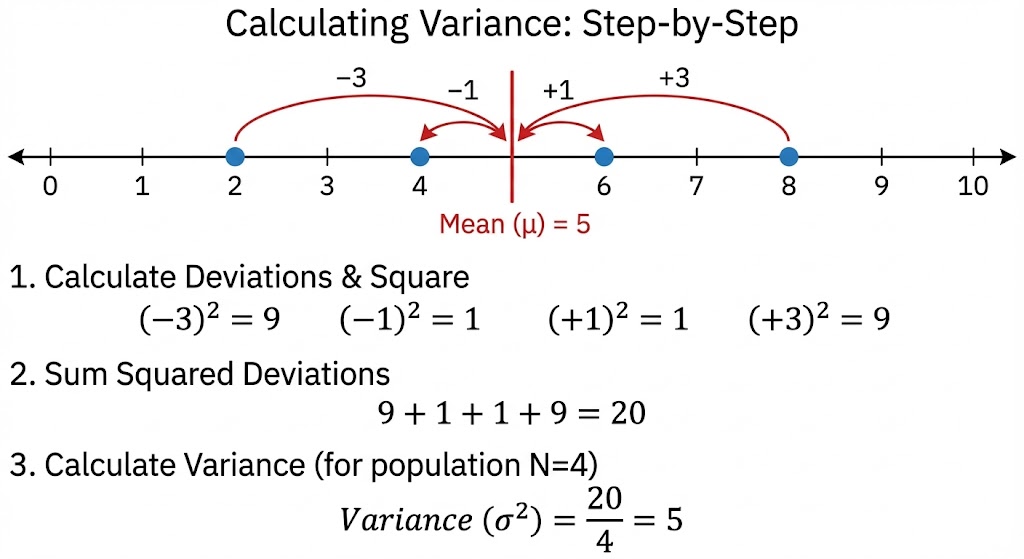
**Problem**: Calculate the mean and standard deviation for the sample data $\{2, 4, 6, 8\}$.
**Steps**:
1. **Find the Mean**:
$$\bar{x} = \frac{2+4+6+8}{4} = \frac{20}{4} = 5$$
2. **Sum of Squared Deviations** (Subtract mean from each value, then square):
$$(2-5)^2 + (4-5)^2 + (6-5)^2 + (8-5)^2 = (-3)^2 + (-1)^2 + 1^2 + 3^2 = 9 + 1 + 1 + 9 = 20$$
3. **Find Sample Variance** (Divide by $n-1$):
$$s^2 = \frac{20}{4-1} = \frac{20}{3} \approx 6.67$$
4. **Find Sample Standard Deviation**:
$$s = \sqrt{\frac{20}{3}} \approx 2.58$$
Common Mistakes
* **Denominator Confusion**: Forgetting that the denominator for sample variance is $n-1$ and incorrectly dividing by $n$.
* **Forgetting Square Root**: Stopping at the variance calculation when the question asks for standard deviation.
* **Unit Error**: The unit of variance is the square of the original unit (e.g., $m^2$), while standard deviation matches the original unit (e.g., $m$).