Graph of a Function
Sketch functions using shifts, scaling, and reflections. Sine and rational-function examples explain intercepts and when graphs can cross asymptotes.
Before planning this topic, check the CSCA Exam Guide 2026 for exam dates, registration, fees, and subject requirements.
Syllabus Alignment
This study guide is organized around the publicly available CSCA syllabus for international undergraduate applicants.
Who It Is For
International students preparing for CSCA Math, Physics, Chemistry, or Chinese exams.
Related Practice
CSCA Practice · Go to questions
Past papers and worked video solutions · Timed mock exams · All subject video lessons
Practice by Topic
Jump from this tutorial to filtered practice questions for the same knowledge point.
Related formulas, concepts, and glossary terms
Mathematics Formula & Concept Reference
- Standard Form of an Inverse Proportional Function
- Standard Form of a Sine Function
- Standard Form of an Exponential Function
- Standard Form of a Linear Function
- Standard Form of a Logarithmic Function
- Standard Form of a Quadratic Function
Mathematics Exam Glossary
Tutorial Content
Graph of a Function
The graph of is the set of points in the coordinate plane that satisfy . When reading a graph, check:
- Domain and range: the input and output values actually represented, including any gaps or open endpoints.
- Monotonicity: the intervals on which the function increases or decreases.
- Symmetry: an even function has symmetry about the -axis; an odd function has symmetry about the origin. In either case, the domain must also be symmetric about zero.
- Zeros and intercepts: zeros are the input values satisfying , corresponding to the graph's -intercepts. If is in the domain, the -intercept is .
1. Plotting points and transforming graphs
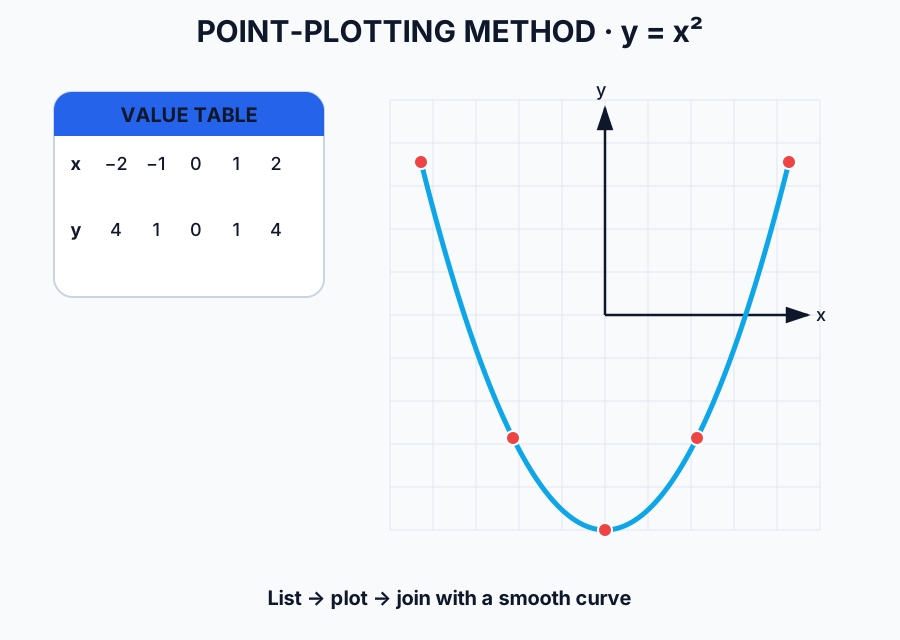
Plotting points
List and plot useful points, then use the function's properties to determine how the graph connects them. Useful points may include zeros, local extrema, inflection points, and domain endpoints. Check continuity before joining points; do not draw a connection across a gap in the domain.
Transforming a familiar graph
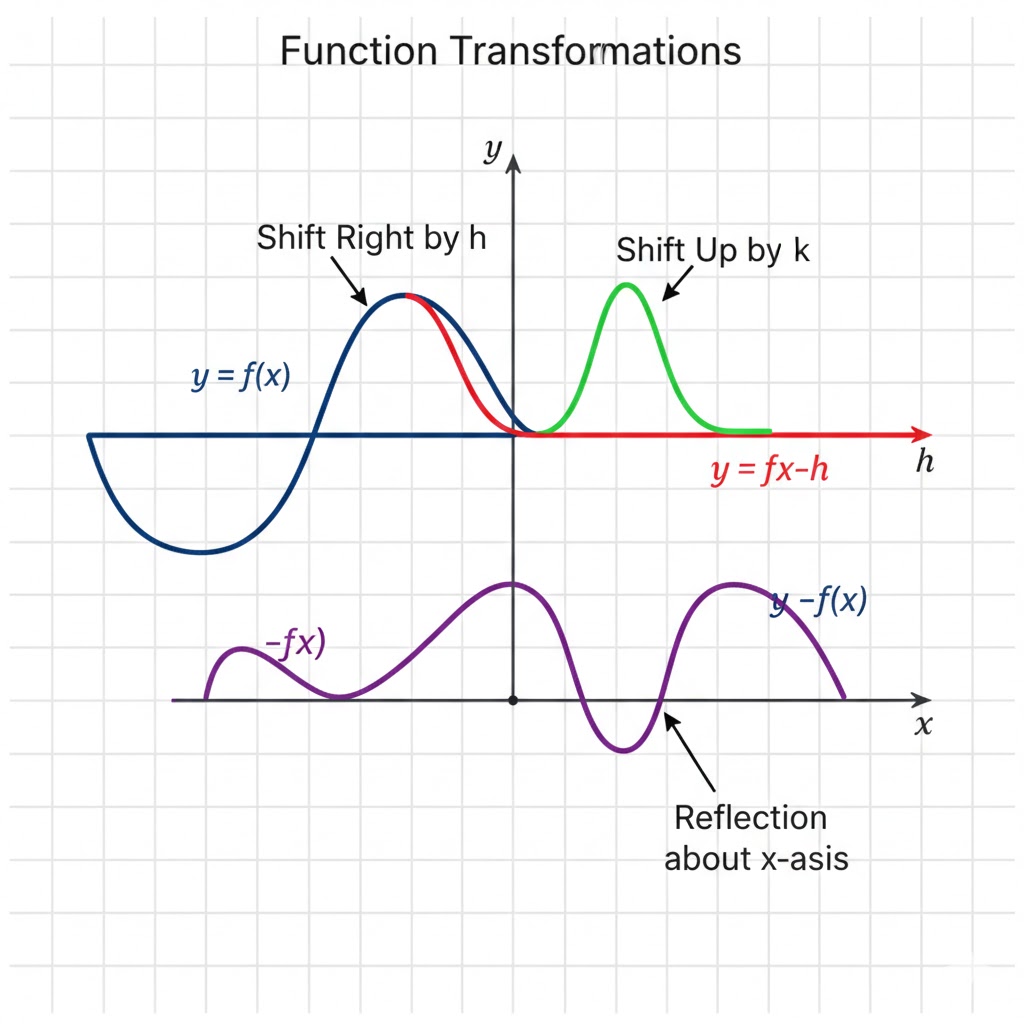
Start with a familiar graph, such as , , or , and apply shifts, stretches, compressions, or reflections.
For the shifts below, and are positive:
- shifts the graph left by ; shifts it right by .
- shifts the graph up by ; shifts it down by .
- stretches the graph vertically when and compresses it when .
- multiplies the horizontal coordinates by . It compresses the graph horizontally when and stretches it when .
- reflects the graph across the -axis; reflects it across the -axis.
- leaves points on or above the -axis unchanged and reflects the parts below it upward.
The scaling rules above assume . Negative factors introduce the corresponding reflections as well.
2. Worked examples
Example 1: Transform a sine graph
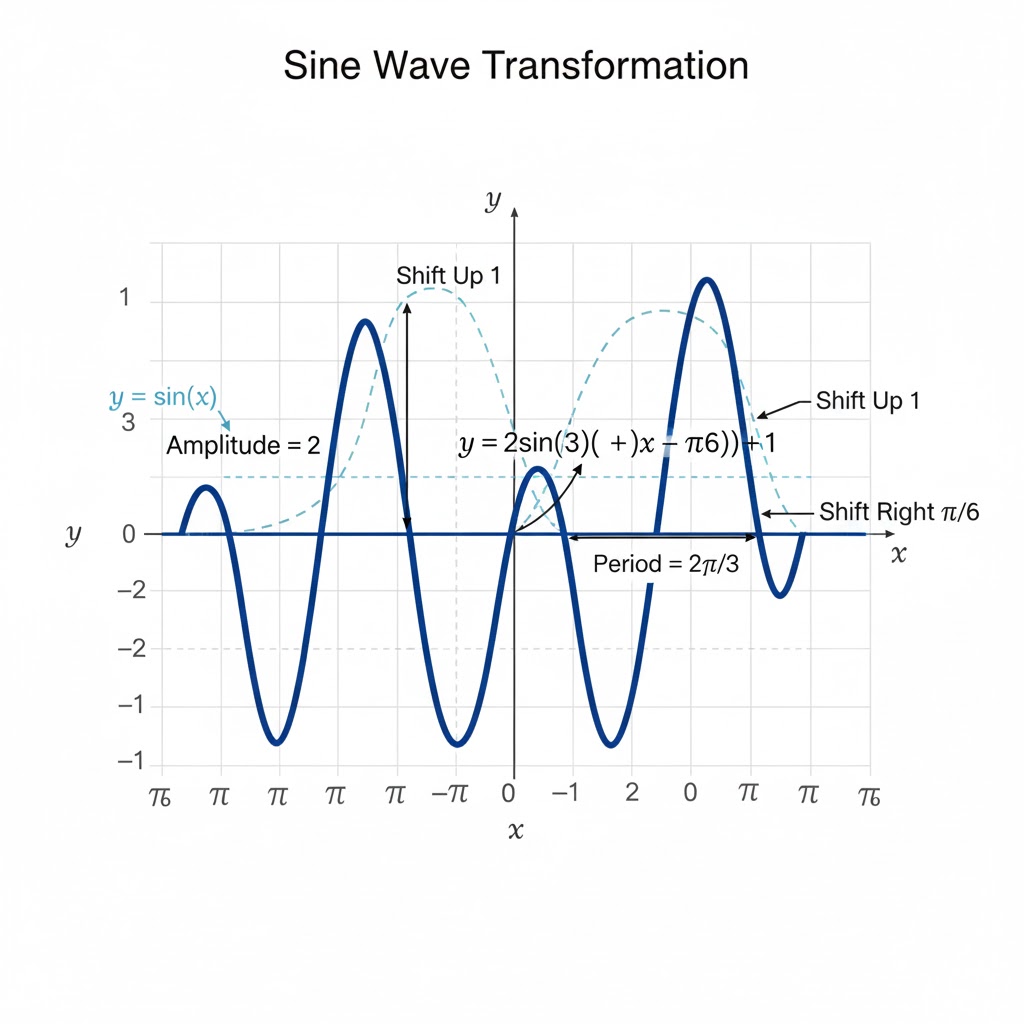
Sketch .
First factor the coefficient inside the sine:
Starting with :
- Multiply the horizontal coordinates by to obtain , with period .
- Shift right by to obtain .
- Stretch vertically by a factor of , making the amplitude .
- Shift up by to obtain the required graph.
The midline is , and the range is . The horizontal shift is , not the that appears in the original expression.
Example 2: Graph a rational function
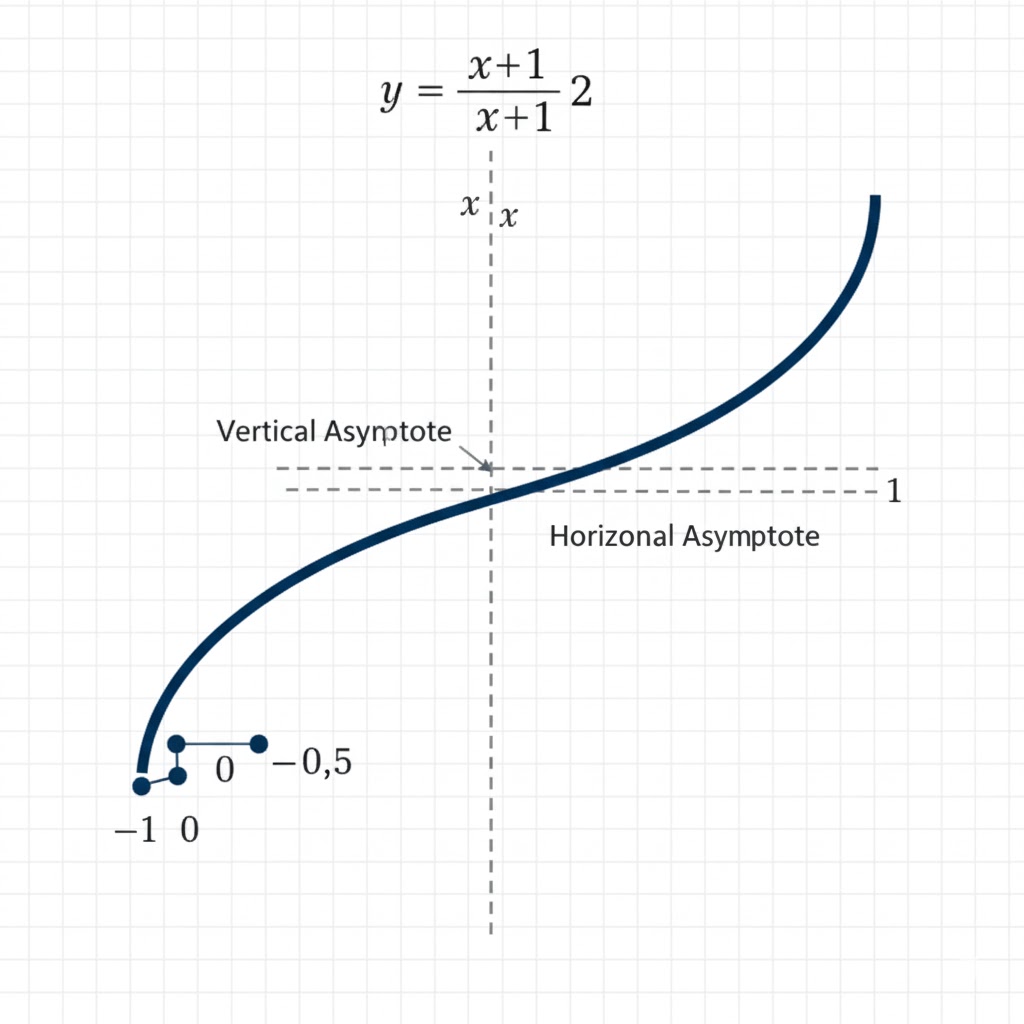
Sketch .
Rewrite it as
Shift the graph of right by and up by .
- The vertical asymptote is . This input is excluded from the domain, and the function tends to negative infinity from the left and positive infinity from the right.
- The horizontal asymptote is , since as or .
- The -intercept is , and the -intercept is .
In this example, can never equal zero, so the graph does not meet its horizontal asymptote . This is a property of this particular function, not a rule for all graphs.
3. Can a graph cross an asymptote?
Horizontal and slant asymptotes describe end behavior; they are not boundaries that a graph is forbidden to cross. A graph may meet them at finite input values.
For example,
approaches zero as , so is a horizontal asymptote. Yet , with opposite signs on either side of zero. The graph therefore crosses that asymptote.
For the rational functions considered here, a vertical asymptote occurs at an input excluded from the domain. Do not join the branches through . A zero denominator does not always produce a vertical asymptote: a canceled factor may instead leave a hole, so check the function's behavior nearby.
4. Before you finish a sketch
- Find the domain before deciding which points belong to the graph.
- Read the structure of before identifying the horizontal shift. Do not use the constant in the expanded expression without accounting for .
- Check whether asymptotes exist and draw them as dashed lines. To decide whether the graph meets a horizontal or slant asymptote, solve the relevant equation instead of assuming that intersections are impossible.
Sources and review
Content reviewed: 12 September 2026.