Probability and Statistics
CSCA Probability and Statistics study guide organized around the publicly available CSCA syllabus. Practice Mathematics questions on aicsca.com.
Before planning this topic, check the CSCA Exam Guide 2026 for exam dates, registration, fees, and subject requirements.
Syllabus Alignment
This study guide is organized around the publicly available CSCA syllabus for international undergraduate applicants.
Who It Is For
International students preparing for CSCA Math, Physics, Chemistry, or Chinese exams.
Related Practice
CSCA Practice · Go to questions
Past papers and worked video solutions · Timed mock exams · All subject video lessons
Practice by Topic
Jump from this tutorial to filtered practice questions for the same knowledge point.
Related formulas, concepts, and glossary terms
Mathematics Formula & Concept Reference
- Addition Rule for Mutually Exclusive Events
- Classical Probability Formula
- General Addition Rule (Inclusion-Exclusion Principle)
- Probability of Complementary Events
- Probability of Complementary Event
- General Addition Rule for Probability
- Addition Rule for Mutually Exclusive Events
- Standardization Transformation for Normal Distribution
Mathematics Exam Glossary
Tutorial Content
Probability and Statistics
Module Framework and Learning Objectives
This module is a core component of the CSCA Mathematics Exam, focusing on the ability to handle random phenomena and analyze data. We will focus on three key dimensions:
1. **Classical Probability**: Understand random experiments, sample spaces, and events. Master the formula for classical probability under equally likely outcomes:
$$P(A) = \frac{\text{Number of favorable outcomes (m)}}{\text{Total number of possible outcomes (n)}}$$
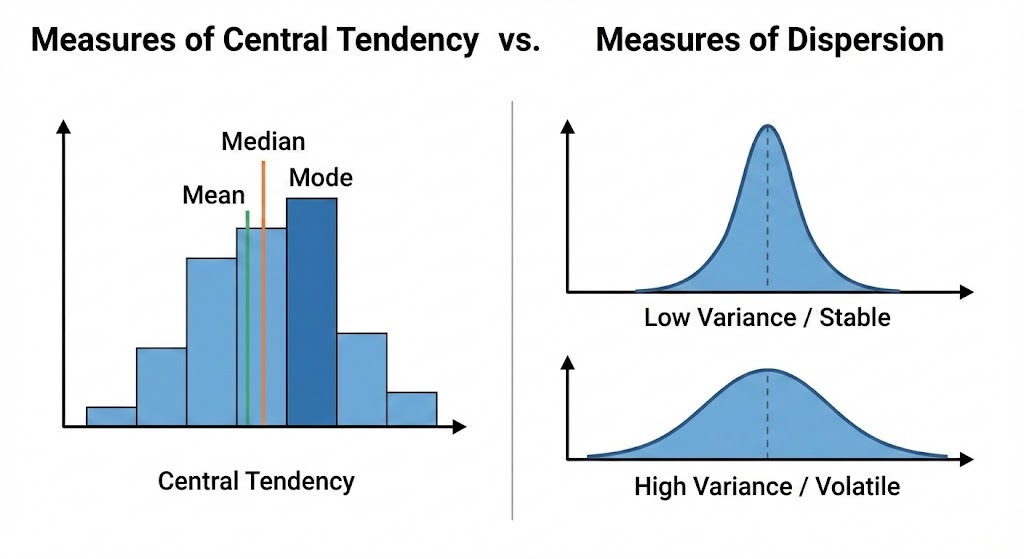
2. **Numerical Characteristics of Data**: Learn to extract information from sample data, distinguishing between **Central Tendency** (Mean, Median, Mode) and **Dispersion** (Variance, Standard Deviation).
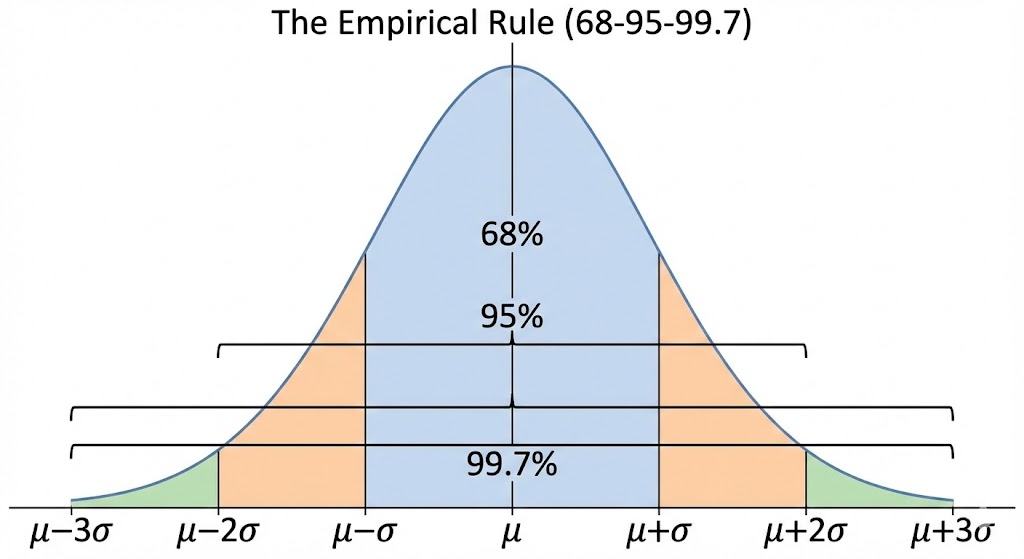
3. **Normal Distribution**: Grasp the properties of the normal curve $N(\mu, \sigma^2)$. Understand that the mean $\mu$ determines the position, the standard deviation $\sigma$ determines the shape (width), and master the **$3\sigma$ rule** ($68-95-99.7$ rule).
 **Learning Objectives**:
* Proficiently use permutations, combinations, and probability formulas to solve counting and probability problems.
* Accurately calculate numerical characteristics of a dataset; understand that lower variance implies higher stability.
* Memorize the probability values for intervals $\mu \pm 1\sigma$, $\mu \pm 2\sigma$, and $\mu \pm 3\sigma$ in a normal distribution.
---
Key Concepts and Global Perspective
Probability theory is "forward-looking," studying the likelihood of events based on known laws. Statistics is "backward-looking," inferring population characteristics from observed sample data.
In this module, **numerical characteristics** serve as the bridge between the two. Especially in Normal Distribution, you need to combine the graph with the following rules:
* The curve is symmetric about $x = \mu$.
* The total area under the curve is 1 (representing 100% probability).
* **The 68-95-99.7 Rule**: The probability of data falling within $(\mu-\sigma, \mu+\sigma)$ is approx. 68\%; within $(\mu-2\sigma, \mu+2\sigma)$ is approx. 95\%; and within $(\mu-3\sigma, \mu+3\sigma)$ is approx. 99.7\%.
 Understanding these logical connections and graphical features will help you quickly translate word problems into mathematical models during the exam.